


MDC Newsroom
The MDC Portal is a self-management platform that provides quick access to our Network Operations Center’s services, your inventory, and other critical information in real-time. It makes it easy to order new cross-connections, on-site support, and more. And to help you get the most of this tool, we compiled this quick guide that covers the main functionalities to get you started.
How to access the MDC Portal
Entering the portal is easy, start by heading to the MDC homepage and click the “Sign-In” button on the upper-right corner. You can then use your username and password or take advantage of the magic link sign-in feature. The magic link is a “passwordless” login option that sends a unique link to your work email, which you can use to get into your MDC Portal account.
Access is limited to current clients of MDC Data Centers. If you’re a current client and would like to access the portal, please request an account by emailing the MDC NOC team at .
Once you successfully log in, you will be redirected back to the home page and the “sign-in” button will be replaced with an “MDC Portal” button – go ahead and click it once more to enter the MDC Portal.
Getting started
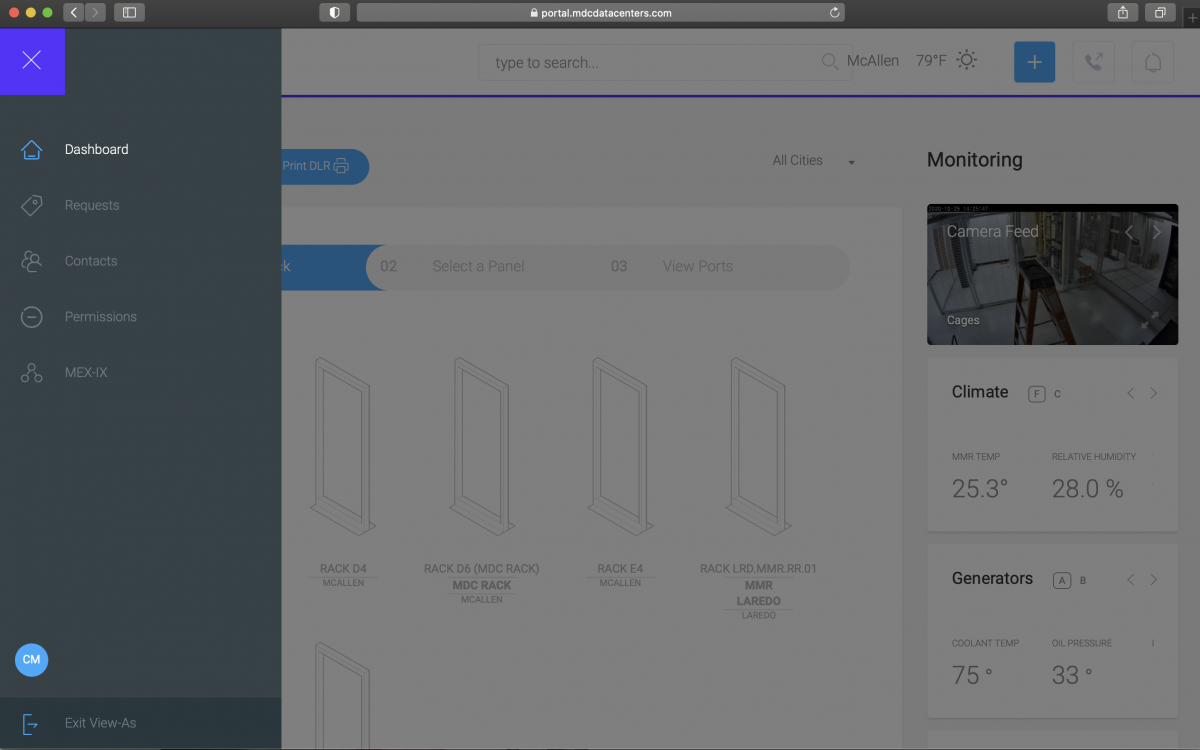
When you enter the portal you will see a navigation panel on the left that displays the following menu options:
- Dashboard
- Requests
- Users
- MEX-IX
Depending on your user’s permissions, these options may differ. Now, at the bottom of the panel, you can find your user icon. This is where you can set your profile information and your security preferences – you can even add a profile picture! You can hide the navigation panel by clicking the ”≡” menu button at the top-left corner.
Let’s head over to the top of your screen where you will find a helpful search tool, it can assist with locating specific information throughout the platform like contacts or trouble tickets. To the right is the shortcut button “+” with the option to request immediate access to our facilities, new cross-connects, and on-site support.
The quick support button (telephone icon) provides quick links to our support phone number, support email, and a directory of our staff with their individual contact information.
If you have an active request you can view all your notifications and system alerts by clicking the notification button on the top right corner. A blue dot over the notification icon indicates that you have unread messages.
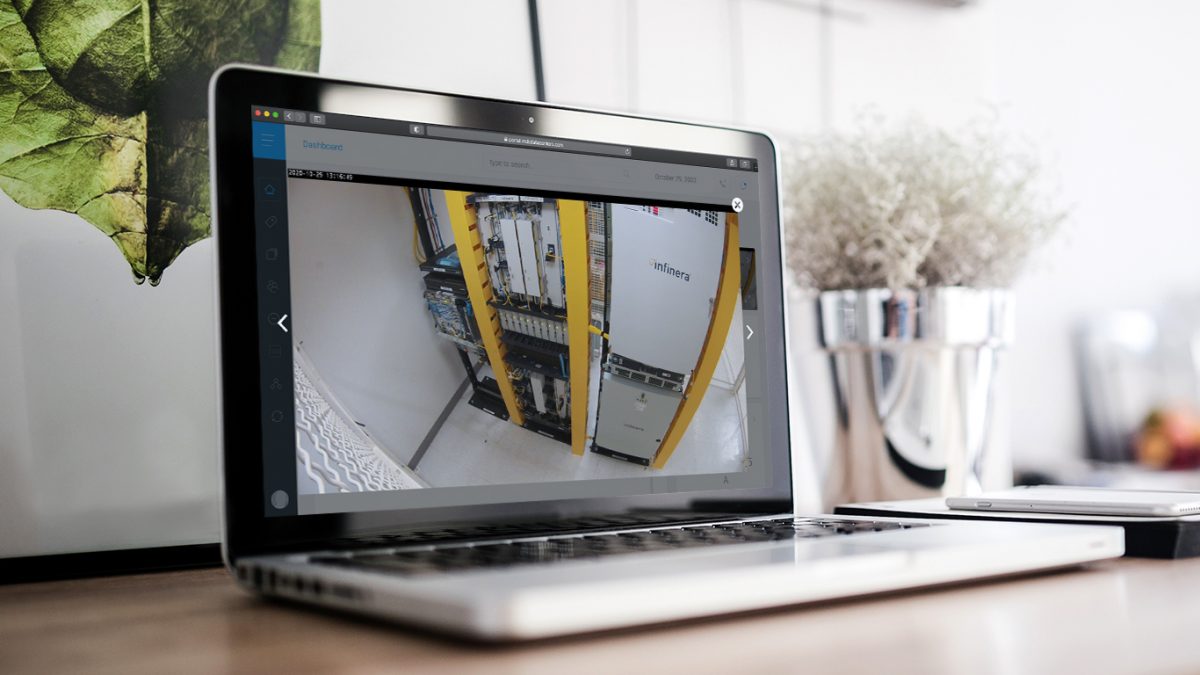
Explore the dashboard
By default, the first content you will see is the main dashboard and it is critical because it displays information about your racks, panels, and ports.
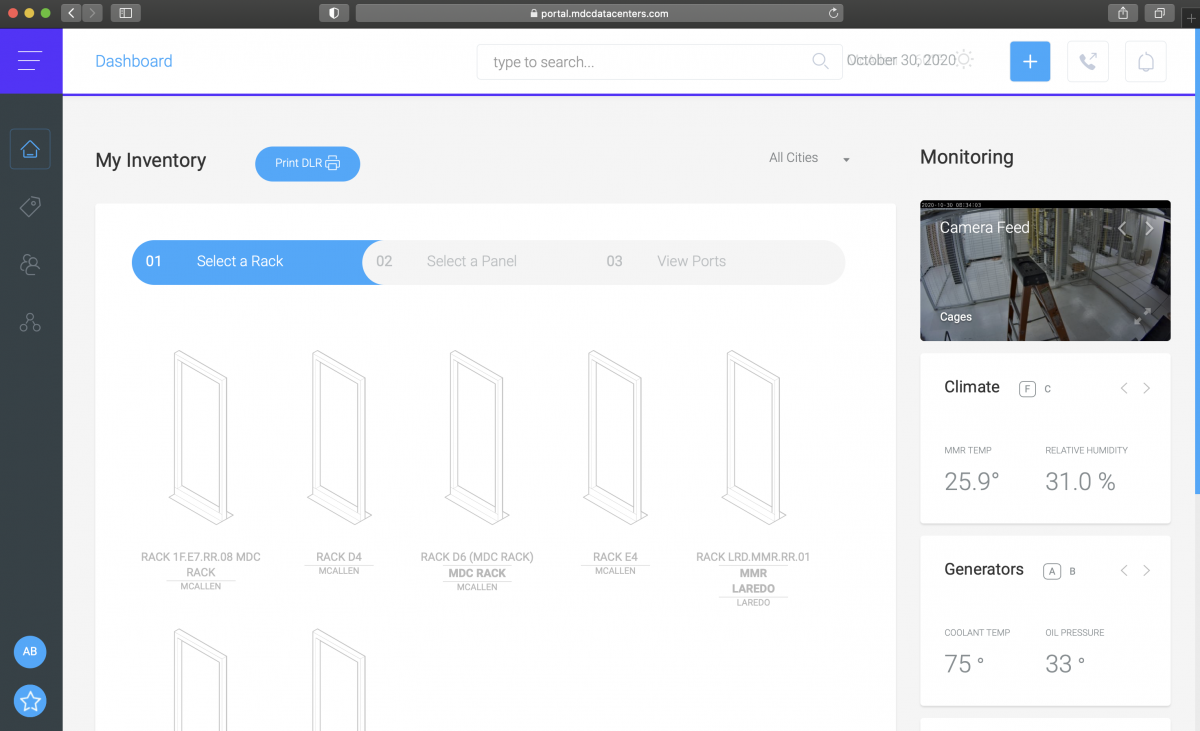
Select a Rack
In this section, you will see the different racks and handholes where your equipment is located. If the rack or handhole is shared, an information icon “i” will appear over it – hover over it to see a list of companies that share the rack. Click on a rack or handhole to view more information about it. You can filter your racks by location, just select one of the options under the “All Cities” dropdown menu.
Select a Panel
When you select a rack you will then move on the panel view (or the conduit view if you select a handhole) and here you can see the different (ODF or EQP) units you have available on the rack you previously selected.
View ports
Here you will see all your active, available, or damaged ports in the panel you selected to view. The clock icon that appears on the ports that are or have been active. If the icon is clicked it will open a new window with relevant information and a history of that port’s activity.
The “Print DLR” button above the progress bar gives access to your Design Layout Record that contains a summary of all your inventory information above in a pdf format.
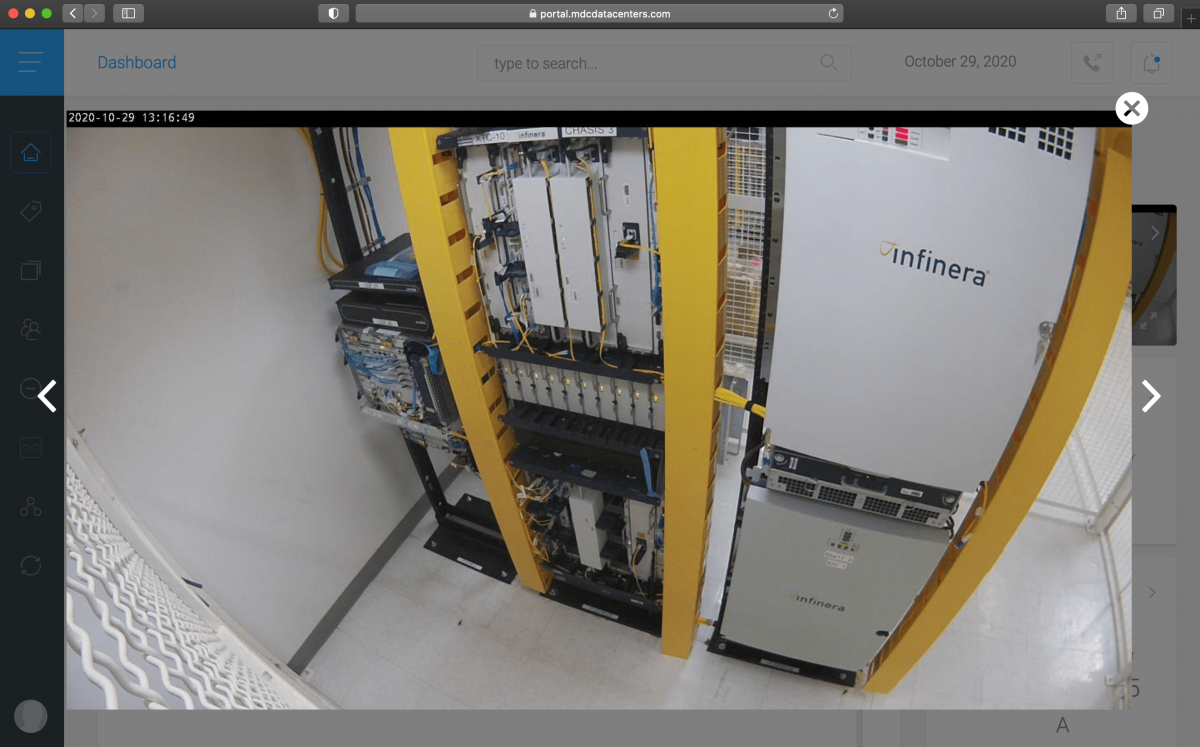
The Monitoring module
On the right of the dashboard screen, you will see the monitoring module that contains a camera feed, information about your support packages, and general information about the climate, power, and generators at our facilities. You can also view a facility access log. The camera feed displays direct views of equipment in real-time and is offered at no additional cost to customers that contract a cage.
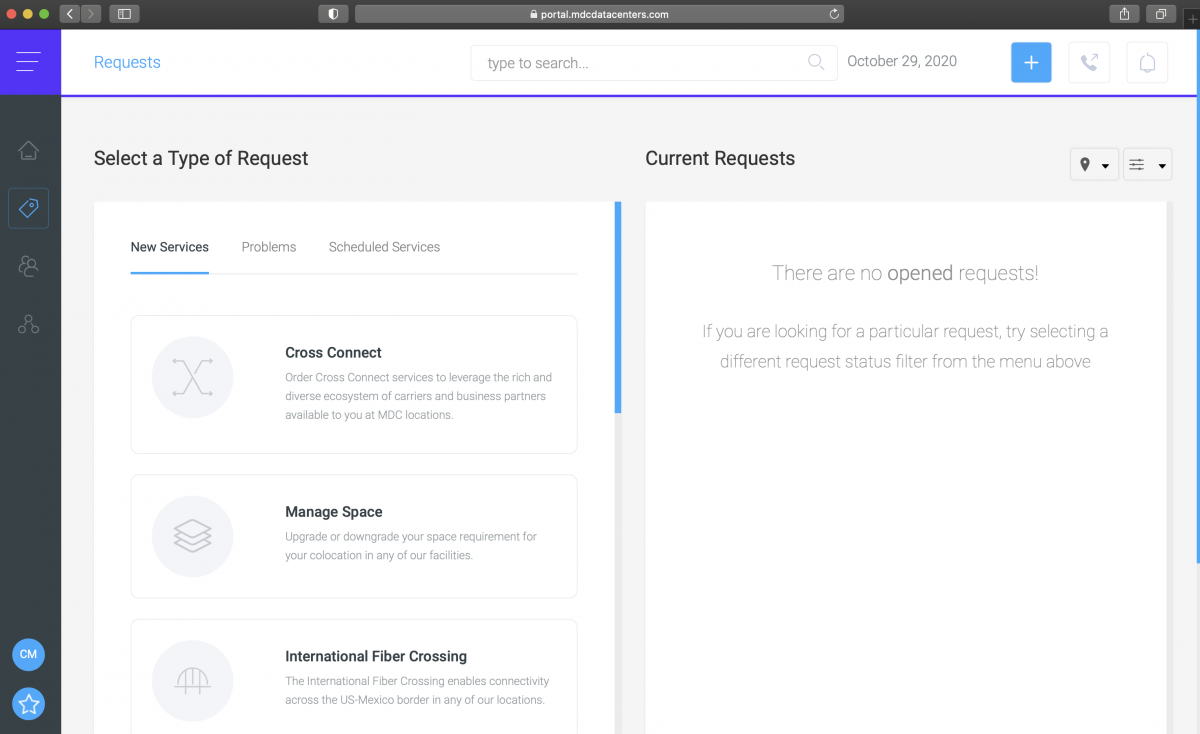
Service requests
In the “Requests” section of the MDC Portal, users can initiate requests for new services, report operational failures, process billing disputes, or manage scheduled services like facility access or inbound shipments. These options are organized under the three tabs on the left:
- New Services (Cross Connects, On-Site Support, OSP Connect, and more)
- Problems (Operational issues or billing issues)
- Scheduled Services (Data center entry, service disconnects, outbound shipments, and more)
Once you review your options, make a selection, and enter the information requested. In most cases, documentation may be required.
On the right half of the screen, you will see a log of your current active requests. Simply click the “+” icon to expand or hide the list of requests of each category. Click on any request row to view all the available information and documentation. You can also filter your requests by location or status.
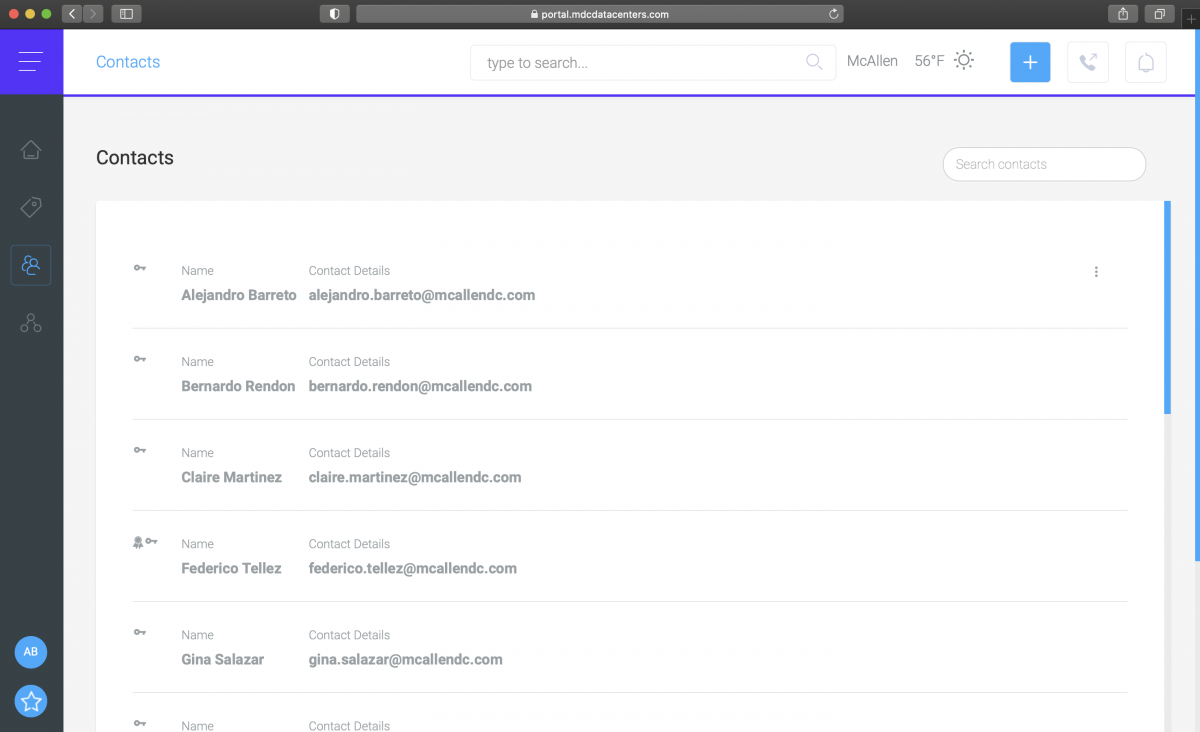
Contacts
Each user is assigned one of the three types of permissions to use the portal:
- Standard: They can only create non-billable tickets and manage their user information
- Managers: They can create any kind of ticket, including the billable ones, and can manage only their user information
- Admins: Can create any kind of ticket and also can manage all users information and users permissions
You can view all the members of your company who are using the MDC Portal under the “Contacts” section. Users with admin level permission can add additional users from here by clicking the “Create user” button.
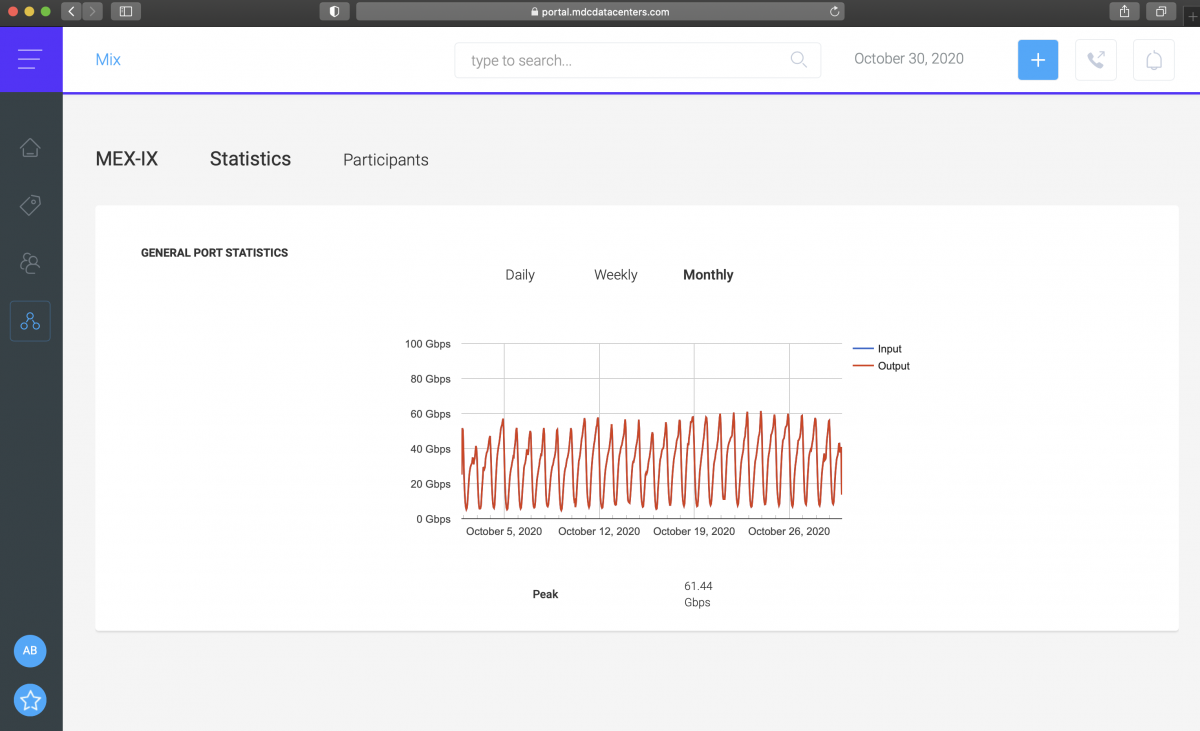
MEX-IX
The MEX-IX is our Internet exchange platform in McAllen, Texas, and in this section of the MDC Portal, you can view the general performance of the MEX-IX – like the input and output on a daily, weekly, or monthly basis. You can also see the current traffic peak below the graph.
You can also explore all the current MEX-IX participants and view their ASN numbers, policy designations, size of their ports, and whether they allow permission to the route server.

How the MDC Portal can help you make better decisions
We understand that our clients deal with many service providers and have a presence in many locations. That is why we designed this platform to make it easy for them to access up-to-date information about their equipment, who they’re connected with, and what services they have contracted with MDC. All while also providing a one-stop-shop for support requests and service upgrades. In short, the MDC Portal can help you save time and money when making important decisions.


